CanalNetworkDocs
Design Production
There are different products that the user can generate from a succesfully compelted design for a canal route. These are three main groups of outputs.
-
Table data:
including design schedule table, table listing for structures/ controls, table listing for flow sections, as well as Setting-out table data.
-
Bill of Quantitity
a report of a detailed and complete bill-of-quantity document suited for export to differnt formats (doc, html)
-
AutoCAD drawings
Including Flow sections, Cross-sections, Longitudinal profile Design, and Plan Views
Below sections show how to generate these data.
Table Data
Table data are results of design work for a particular canal route that can be presented as a table listing. The following are typical table data that can be generated for a selected route.
-
LSec Profile Data
-
FLow Section Data
-
Schedule of Controls, Drops, Turnouts, and Division Boxes
See Exploring Solutions under Longitudinal Design of Canals Section, for details on each of these.
Bill-of-Quantity
Bill of Quantity document is one of the key outputs of a design task. In CanalNETWORK product, this is a fully automated process. The output can be created in many different ways.
Note: Often, the volume of cut and fill involved for a canal route is a design decision tool. To explore these values, the best way is to use the annotation tools from
Explore Solutions > Annotators. See relevant section in this guide.
Preparing for BoQ extraction
Before BoQ can be extracted accurately, all elements of the canal route - i.e., profile data and structures data must be updated. To ensure all data for the elements correspond to the most recent design changes, fully exploring solutions is a mandatory step, especially before BoQ extraction. This ensures that every element of the canal route are upto date.
This can be easily achieved by invoking the batch process from Explore Solutions > Batch Processes > Batch Explore SubRoutes.
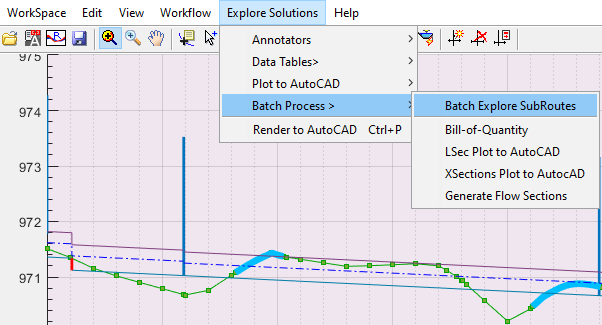
This will invoke the following dialog, indicating which level is selected currently (in this case TC) and to confirm which levels of canals to automatically explore and update.
Once can choose a single level, or multiple levels. In either case, a confirmation is requested that lists the name and number of canals that will be processed.
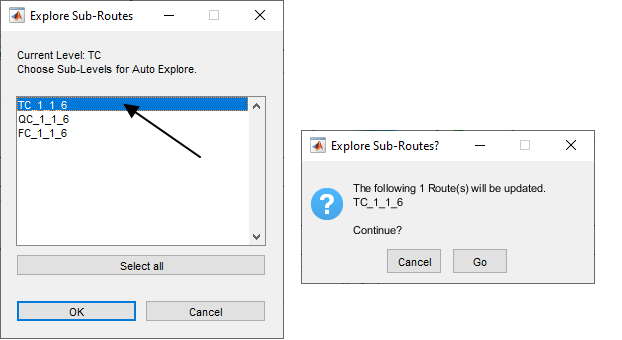
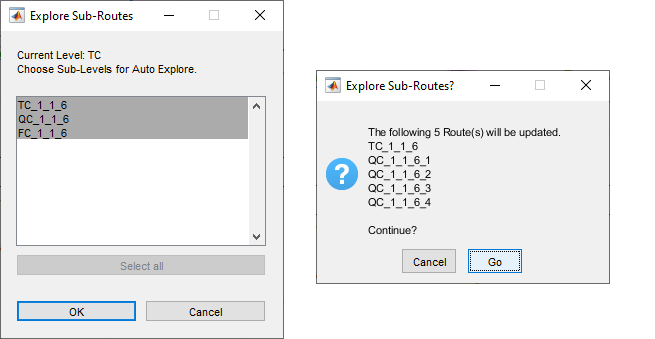
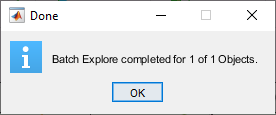
Confirm Go and all relevant canal routes are auotmatically updated for the latest design data. The following dialog confirms the actions taken.
Note: BoQ created with out updated control and structures data can be incomplete, or inaccurate.
Bill of Quantity for a Canal Route
The general steps to creating a bill-of-quantity output is as follows:
-
Select the desired canal route(s) whose Bill-of-Quantity is desired in plan view.
-
Go to
Explore Solutions > Data Tables > Generate Route BoQorExplore Solutions > Batch Processes > Bill-of- Quantity. The choice will depend on the user. The proceeding topics will cover different levels of BoQ outputs, and how to create them.
-
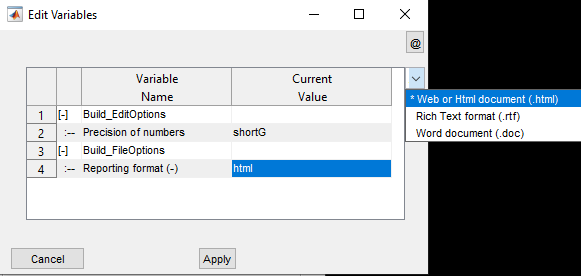
Set the desired reporting format, and accept. There are three options available: .rtf, .doc and .html options. While the former two create an editable text format suitable for MS Word, the last option creates and displays the output to the default browser.
Hit
Applywhen done.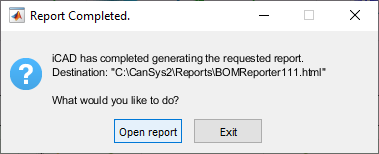
Select
Open Reportto view the report. This will invoke the necessary applicaiton to view the report.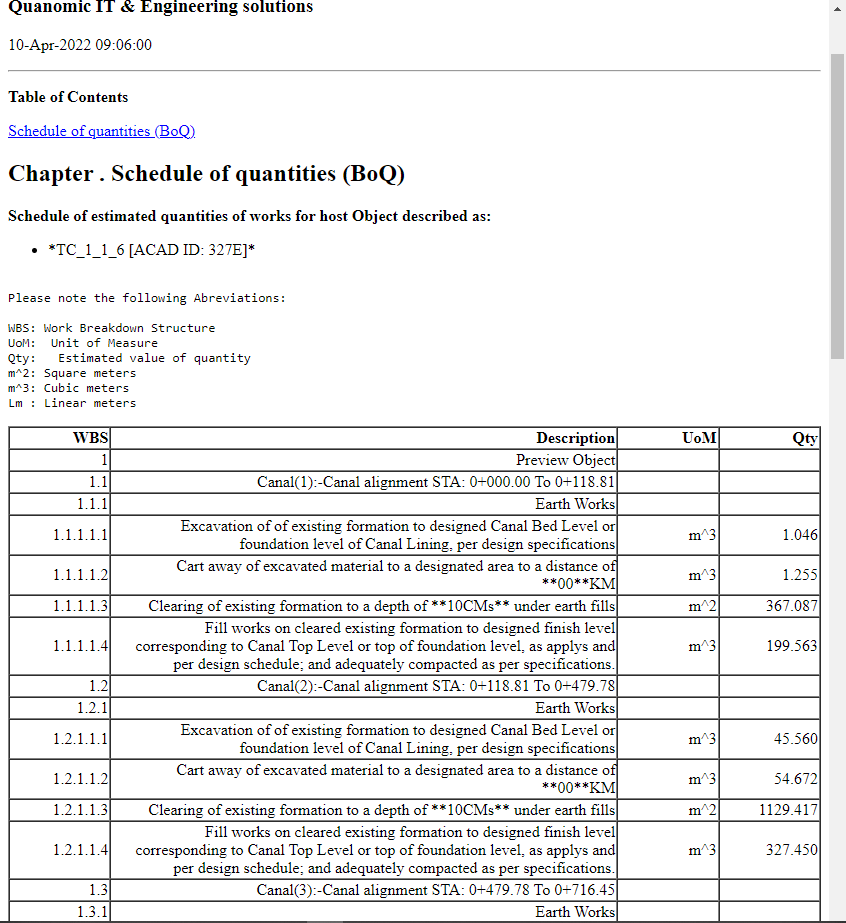
Note: End-of-Route turnout structures are always excluded from Bill-of-quantity listing.
Note: Closely spaced drops, whose placement creates an overlap during excavation, are skipped in BoQ. The user is notified accordingly, to resolve the issue and try again.
Below are the different types of BoQ reports that can be generated.
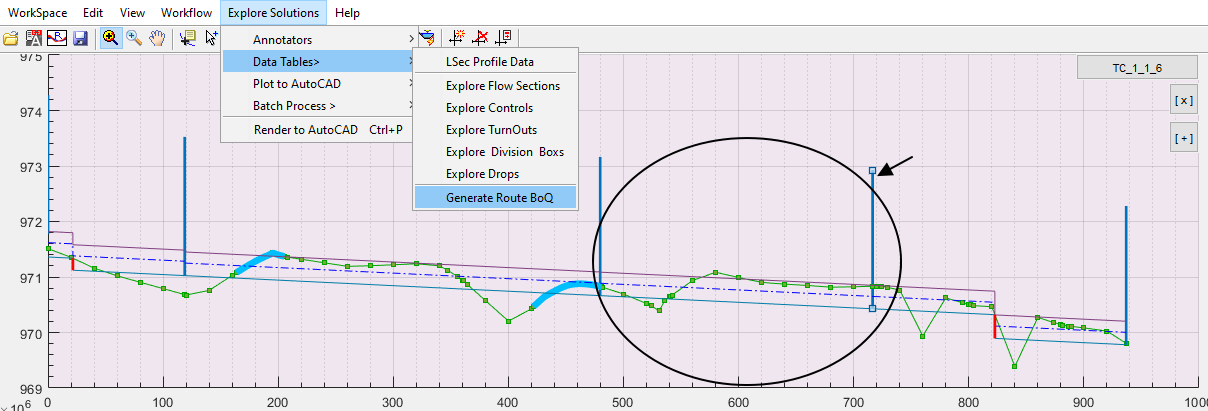
BoQ for Canal Segments
BoQ can be generated for a single segement of a route, that is the reach between any two control nodes. To do this:
-
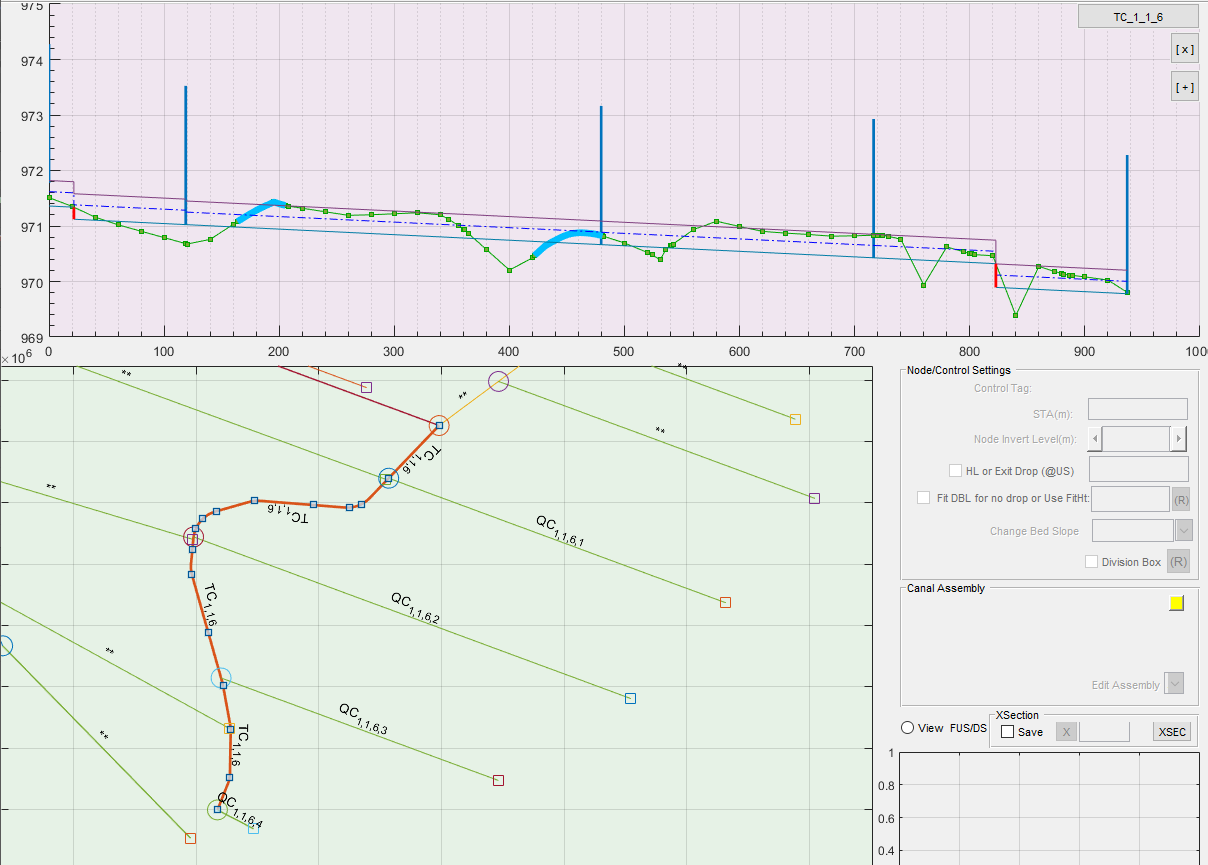
Select the node at the downstream end of the desired segment in profile view. In the figure below the segment upstream of the node at arround STA 700 is selected.
-
Start the command from
Explore Solutions > Data Tables > Generate Route BoQ. Follow the general steps to complete the process. Below is the extract for the segment. Notice, the report ONLY includes the range of the selected segment.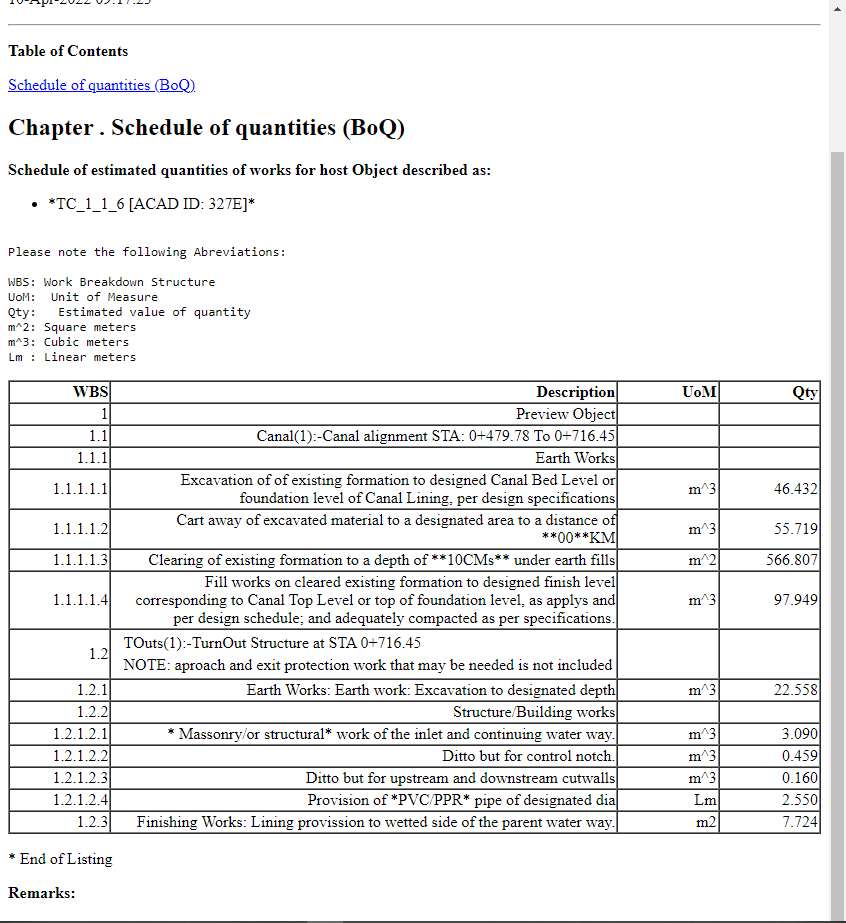
BoQ for Select group of Canals
Sometimes, extracting BoQ for selected group of canals may be needed. For this approach, the desired canals are instanced to an AutoCAD host object first. Then, using the Explore Solutions > Batch Processes > Bill of Quantity will do the job.
-
Enable Multi-Select from
Edit > Multi-Select, and select the canal routes whose BoQ is desired in Plan view. This can be manually, by right clicking on each route. If the canals are branches of one parent canal, this can be conveniently done by first selecting the parent canal, and then usingEdit > Select Routes > Select Sub-Routesmenu command.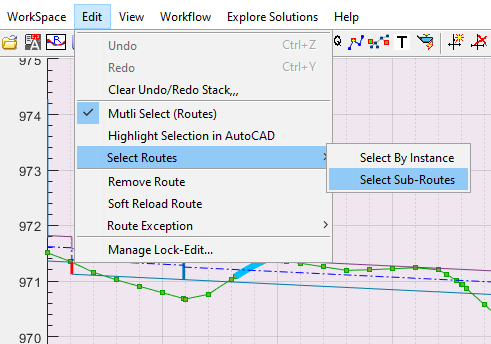
This will raise the Sub-Route selection dialog.
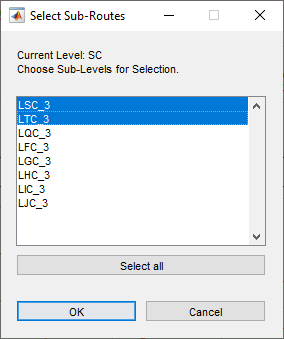
Note: The lists contain all possible leves defined in the Naming Style used for the project. The currently selected route may not have all the listed levels.
Pick the canal generations to include in the selection, and hit
Ok.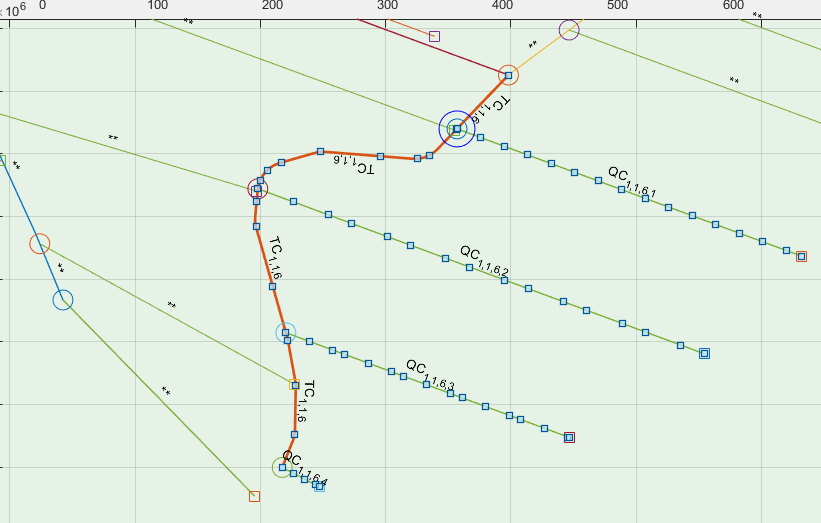
In the above example, this will select all the branches of the TC canal, including the TC canal itself.
-
Prepare a host object in AutoCAD for the instance data. Then instance the selection from
Workflow > Prep Network > Create Instances.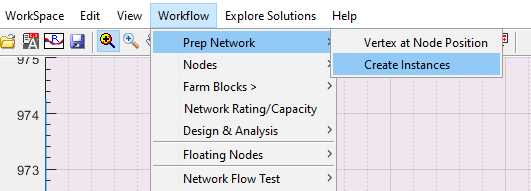
This will list the objects currently selected.
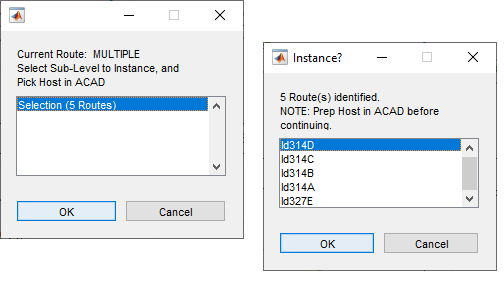
Confirm action, and AutoCAD will be in select mode. Pick the prepared host object.
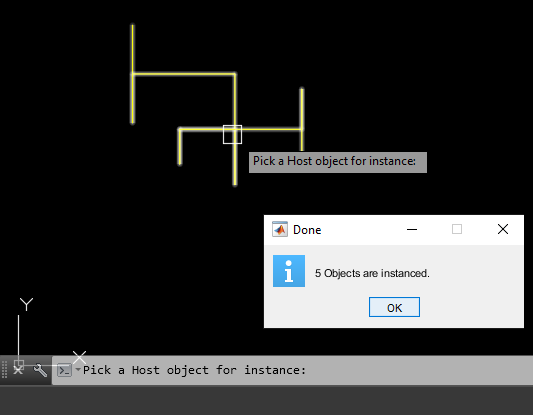
The Done dialog will confirm the results of the action.
-
Finally, use
Explore Solutions > Batch Processes > Bill of Quantity. AutoCAD will be in select mode. Pick the host object prepared.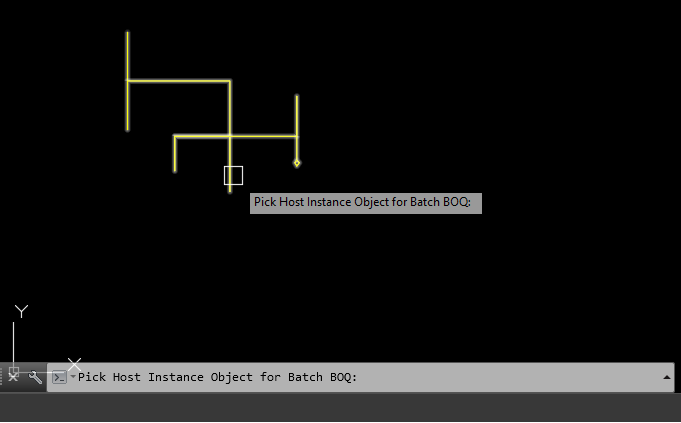
The process will automatically update all data contents for each of instanced routes, and report status.
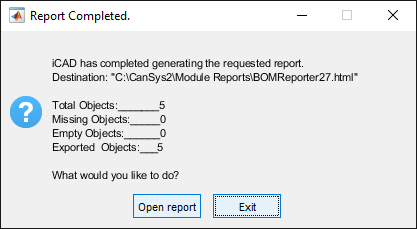
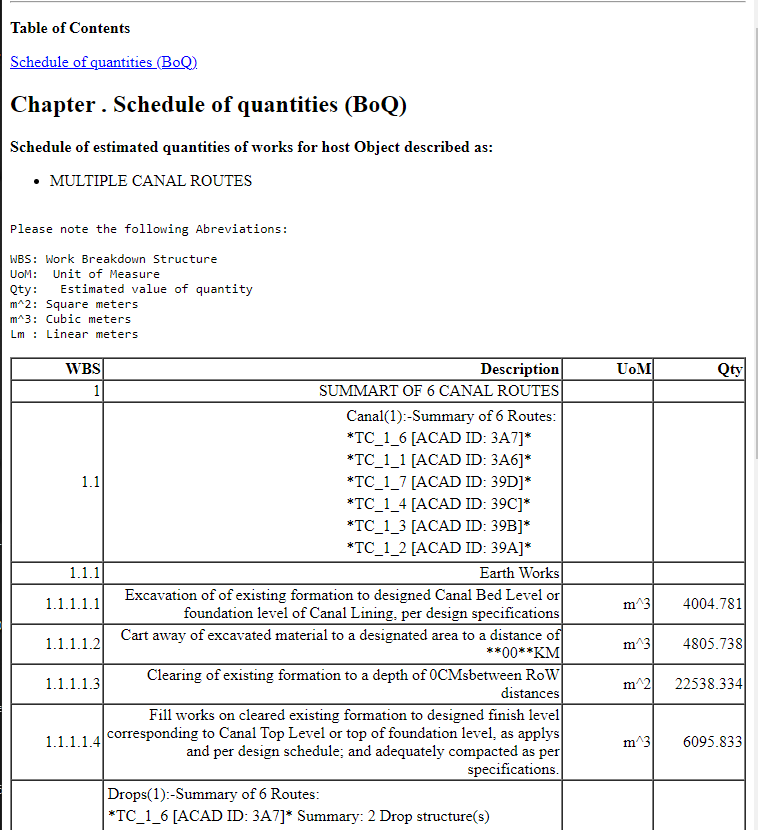
Confirming Open Report will display the data extracted. Notice the title for the report indicating multiple routes are selected for the listing.
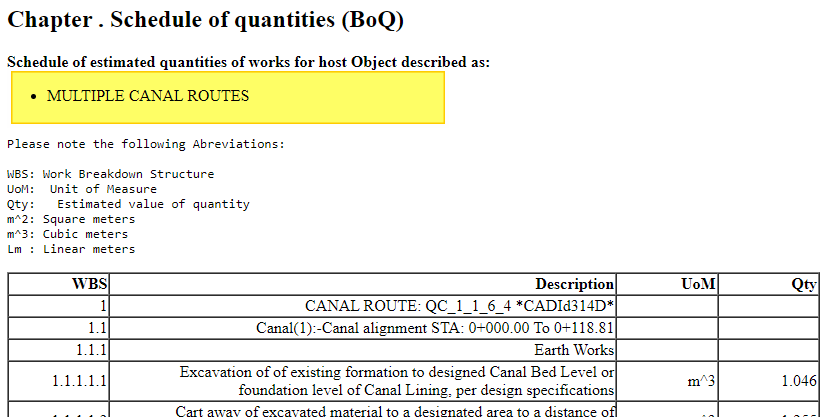
Notice the title indicating multiple canals are selected for the BoQ listing.
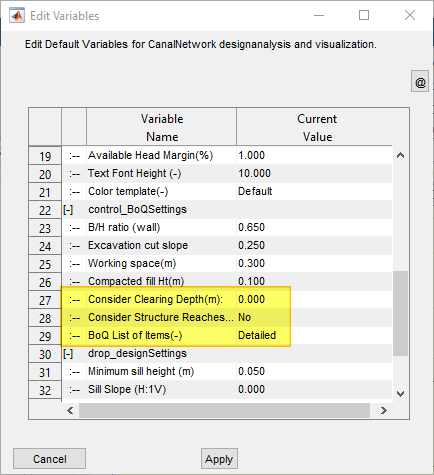
Settings for BoQ generation.
Quantity listing depends on values set to selected paramters. There are three imprtant parameters that affect the level of detail considered for quantity extraction.
-
Detailed or Summarized Listing
-
Considering Clearing Depth
-
Considering Structure locations
These parameters cab be set flexibly by the user from Workspace > Edit Preferences... menue command.
-
BoQ List of Items:
Detailed [Default] lists each componenet of the canal route separately, often resulting in a very long list.
Summarized: Using this option creates a listing that summarizes Canal Segments, Drops, Turnouts, and Division Boxes separately.
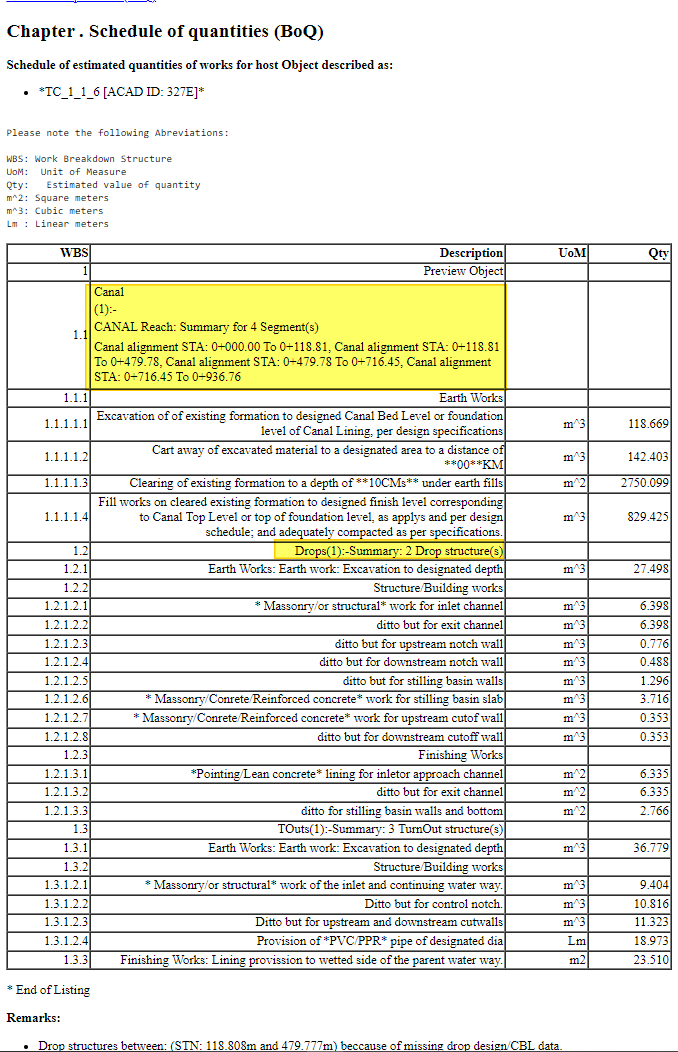
The above snapshot shows a summarized listing. Notice the description column for Canal, and Drops, explicitly listing summary for a number of segments and structures respectively.
SummaryOfSummary: groups items together for summary display. This option woks ONLY for canals of the same generation,i.e., Multiple TC canals or Multiple QC canals for instance.
-
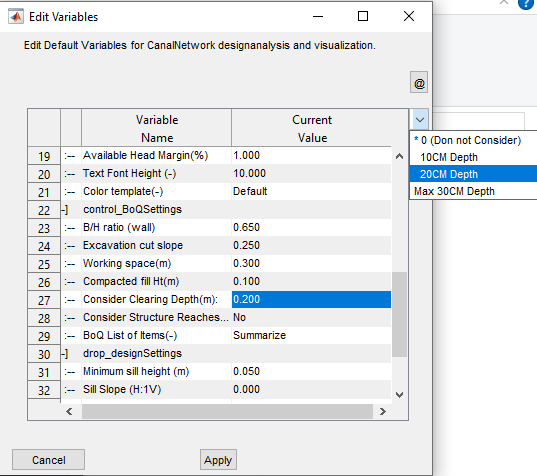
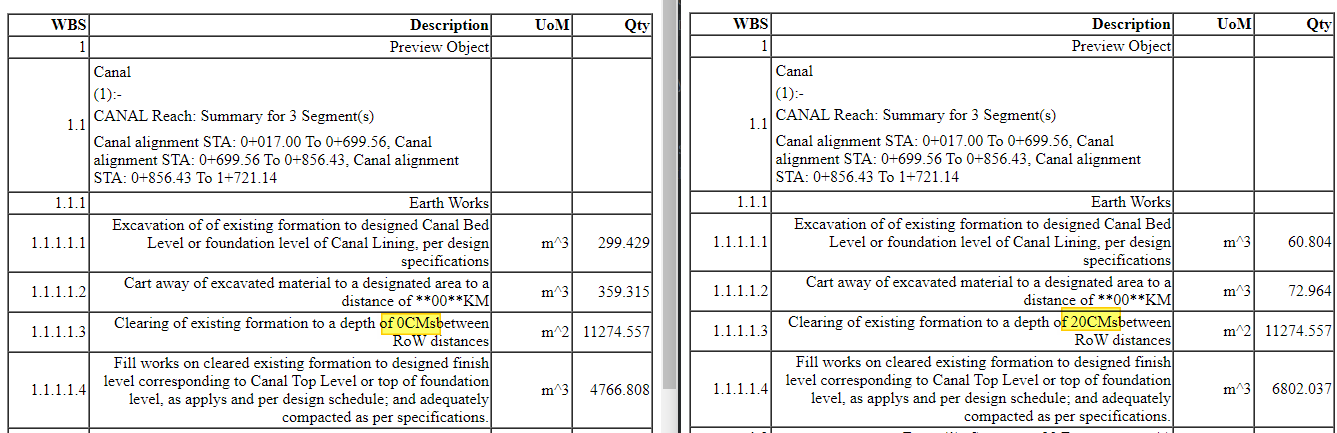
Clearing Depth:
0 [Default]: This is the default setting, that assumes no clearing activity, and sets the clearing depth for the quantity listing to zero. Excavation and fill works on canal segements are calculated to existing ground level (OGL) formation.
d>0: Using this option does two things:
(a) Change listing for Clearing to the specified depth
(b) Account for specified depth of clearing, when calculating cut and fill areas at each station.
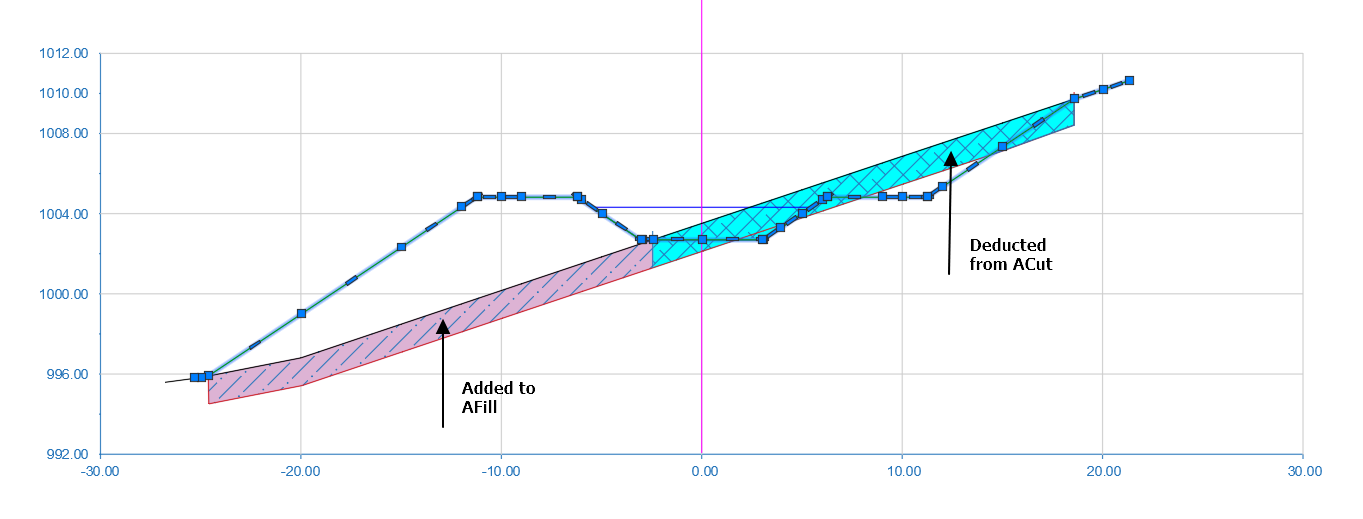
This schematic shows how clearing depth is considered for improving the accuracy of earth work estimates. Note also that, the clearing depth is exagerated for demonstration purposes. The shaded region represents area deductions and contributions to cut and fill data, respectively, extracted in Profile Data listing.
Note: After changing this setting, update the profile data for the route using
Explore solutions > Table Data > Profile Data. Else, the changes are not captured in BoQ listing.Below example shows the difference in quantity for d=0, and d=20cm. Notice the highlighed difference in listed clearing depth, and corresponding volumes for Excavation, Cartaway, and Fill works.
-
Structure Reaches
No [Default]: this is the default setting, and reports cut and fill volume listing with out considering those due to the structures. Note, earth works are also reported for structures separately. Therefore, this may slightly increase the quantity listed for canal earth works.
Yes: This option, considers structures location in calculating earth cut and fill volumes. In this method, the begining and ending of each structure including working space at both ends is used to exclude station items from calculation. For this method, if the strucures are explored, the designed lengths are used to determine the begining and end of each structure. If not, however, a default value is used as follows:
Turn Outs:
-
length before station= 1.2 + sqrt(Q) Working Space
-
length after station= 3.0 + Working Space.
Drops Structures:
-
Length before station= 1.25*Drop Height
-
Length after station= 2.25*Drop Height
-
-
As may be expected, cut and fill volumes to canal segments reduce with this option enables.
Note: Only turnouts and drops are included in the recent version. Future versions will be updated to account division boxes as well.
Longitudinal Profile (LSec) Drawing Generation
Generating longitudinal profiles drawings, also known as LSecs, can be done either for individual canals or for a group of canals. The latter will be uising the Batch Process commands. Either way, LSecs can be generated at any desired increments, if needed creating multiple LSec drawings for a single canal route.
Generating Longitudinal Profile drawing for single canal route
Click on the desired route object in Plan View. The longitudnal view will be displayed on the profile view axis.
Then:
-
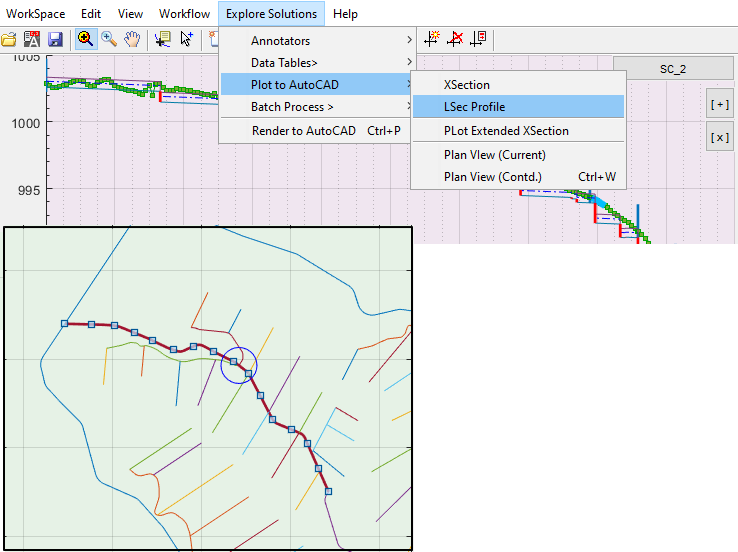
Go to
Explore Solutions > Plot to AutoCAD > LSec Profile. If table data is not complete and available, you will be prompted to extract and try again.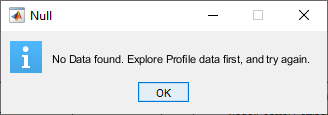
-
In the dialog set the station range for which the drawing is required. You can click on the more option button at the top right, you will see that you can choose to generate a 1000m long range or the entire range. Choose appropriate option, or set your own, and hit
Apply.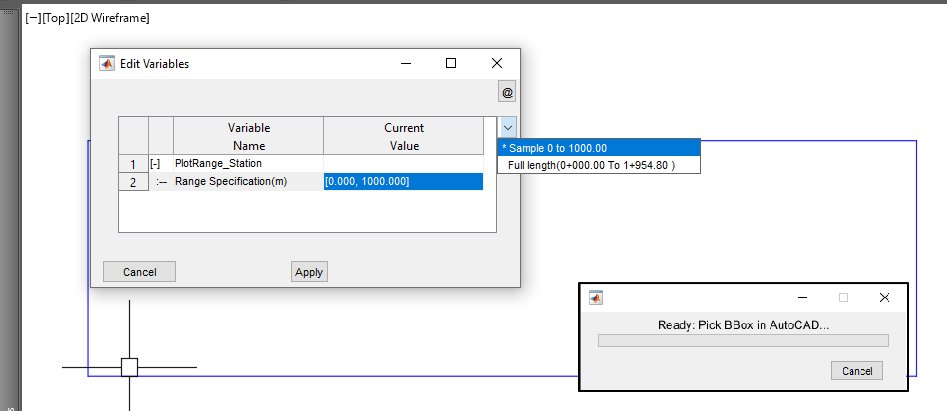
-
AutoCAD will be in select mode. Pick a bounding box where you want the drawing to be placed. This is often a rectangle object. (See below on scaling of drawings).
-
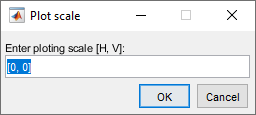
Next you will be prompted to input scaling. Accept the default 0,0 if you want the drawing to fit the box selected. For standard production, you will need to set your own values.
-
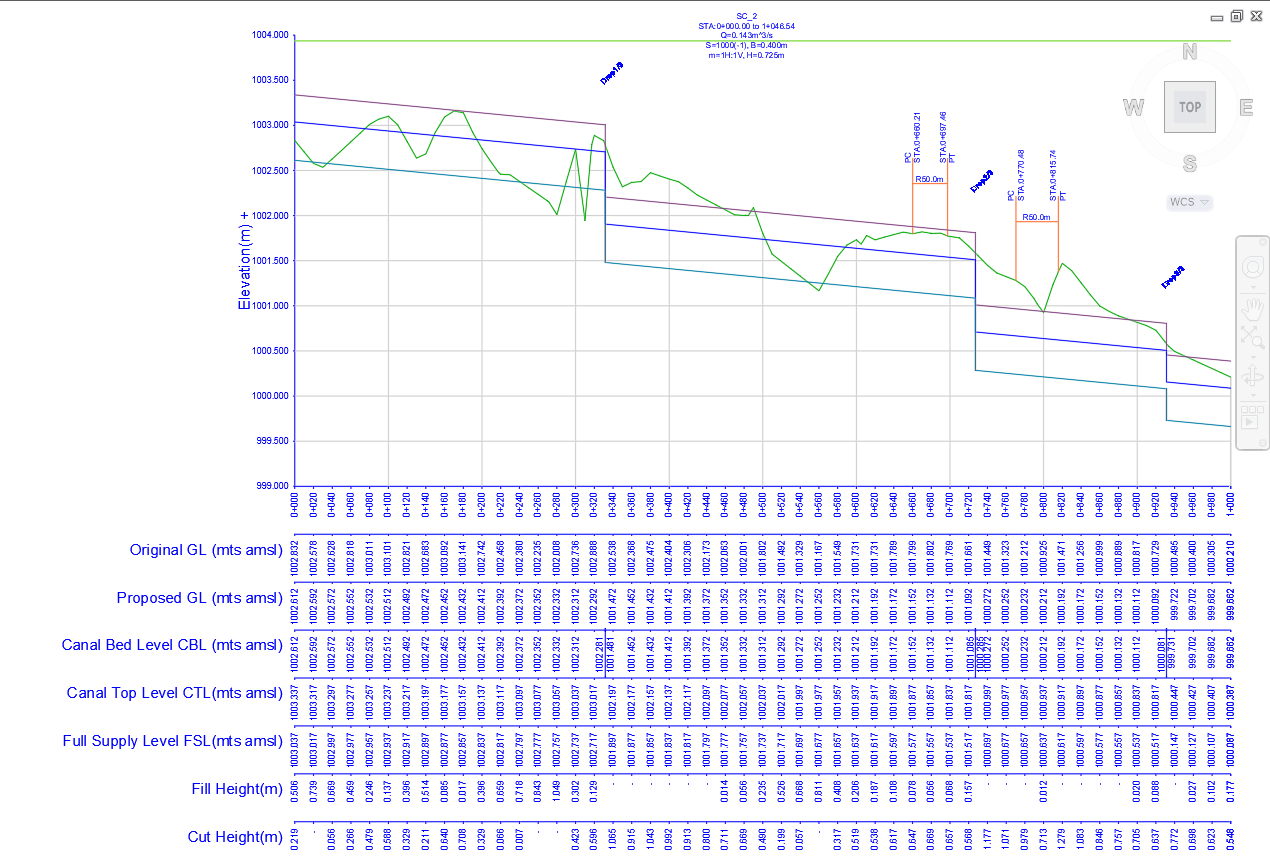
The drawing is generated in AutoCAD as shown below. It contains detailed route and curve information including drops, curve markers, and range labels.
Generating Longitudinal Drawing for multiple ranges of a canal route
Often, a canal route is too long to create a single profile drawing. Multiple drawings are required to do the job. This can be done using the batch process option. Start by selecting the route you want on plan view.
Then:
-
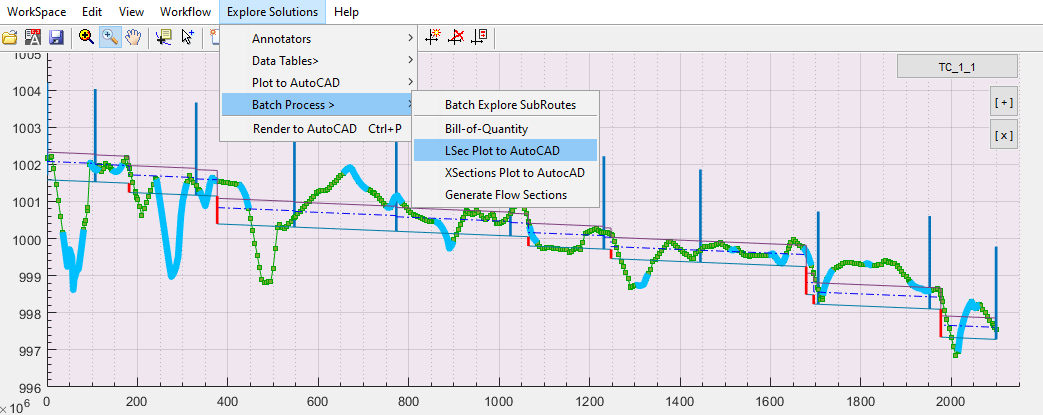
Go to
Explore Solutions > Batch Process > LSec Plot to AutoCAD. This will invoke the dialog where you can set the station ranges you want to generate. Use the option button to see default settings.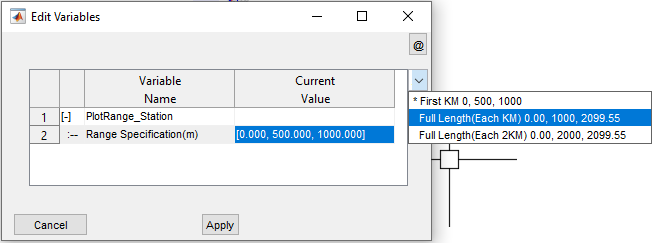
The values are input as follows: [Starting Station, Incremental Length, Ending Station]. For the figure shown above, the route is a little over 2000 meters long. So choosing the range setting of 0, 1000, 2099.55 will create LSec drawings each 1000m long until the end of the route.
-
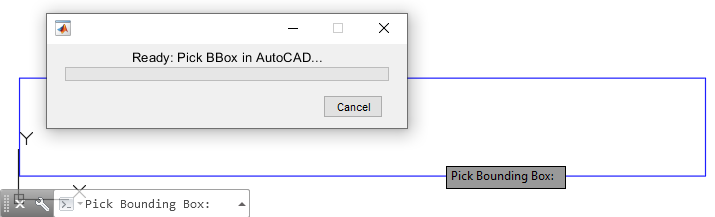
When prompted, pick the bounding box object. This will be the area where the first drawing will be created. The next drawings will be generated next to this box (to the right) automatically.
The progress is displayed in a dialog box.
All the LSecs in this session will be created using the scaling you provide here.
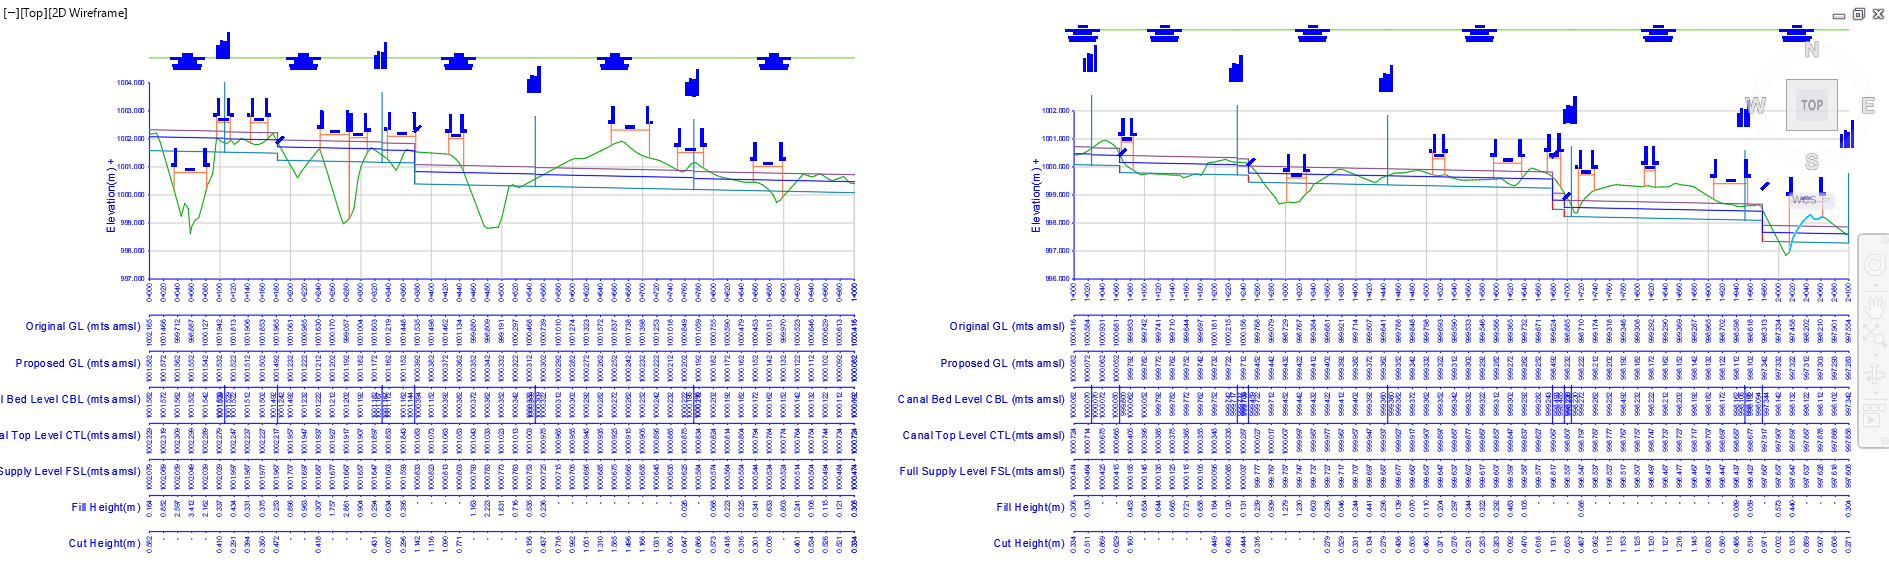
You can see that two drawings are generated, although three is expected 0-1000, 1000-2000, and 2000-2099.55 The algorithm will combine small length drawings to previous ones for presentation quality. Hence the two drawings for station ranges from 0-1000, 1000-2095.5.
Creating Longitudinal Profile Drawings for multiple canal routes
The steps to creating profile drawings for multiple routes are similar to the batch process workflow shown above. Before starting the process make sure all the canal routes have the necessary data for production of drawings. Then:
-
Turn-on multi-select mode from
Editmenu, and select all the routes whouse profile drawings are required inplan view.Tip: To select all subroutes of a given canal, you can use
Edit > Select Routes > Select Sub-Routes. This is helpfiul to generate all QCs of a TC route at the same time, using the same scaling and appearance. -
Start the batch process from
Explore Solutions > Batch Process > Lsec Plot to AutoCAD. -
When prompted provide the scaling desired, and watch it all happen in AutoCAD.
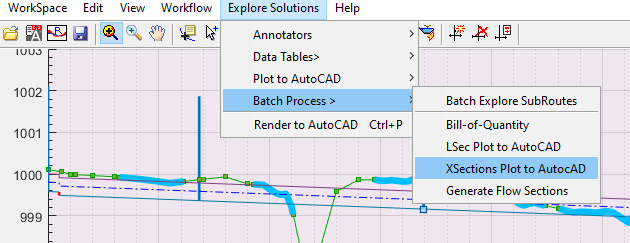
Cross Section Drawings
Cross-section views can be generated to AutoCAD in one of three ways. The first method allows to generate cross-sections at preset intervals. An other way is to select and plot desired stations only. The third method allows users to save specific locations whose cross-sections are required, and generate only those specific sections.
The command to execute this task is accessible from Explore Solutions > Batch Process > XSections Plot to AUtoCAD.
Note. In all cases, the cross-section view is generated FUS with respect to the current route. This is in line with the convention adopted for profile data extraction.
1. Cross-Sections at increments
To use the first method, start by switching off the XSEC toggle button at the top of the detail view area. Then start the command. You will be prompted with available options for incremental cross-section generation.
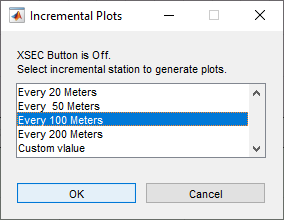
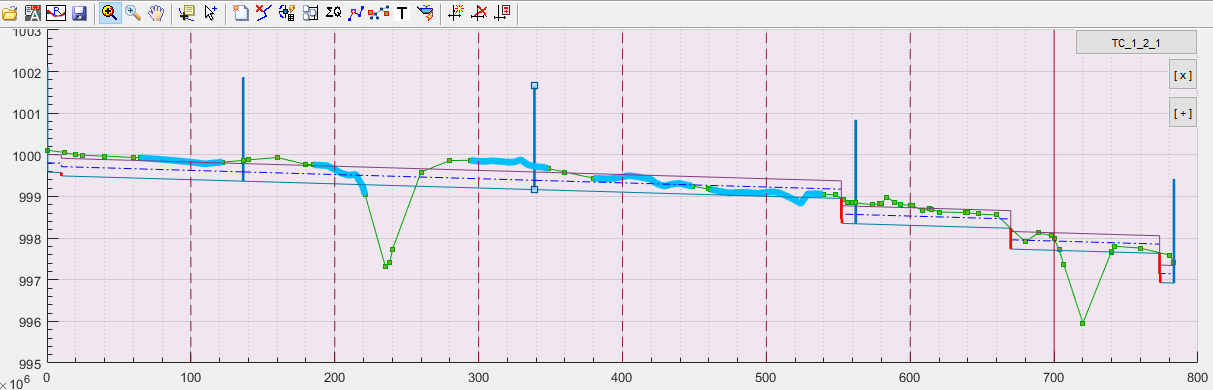
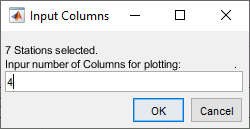
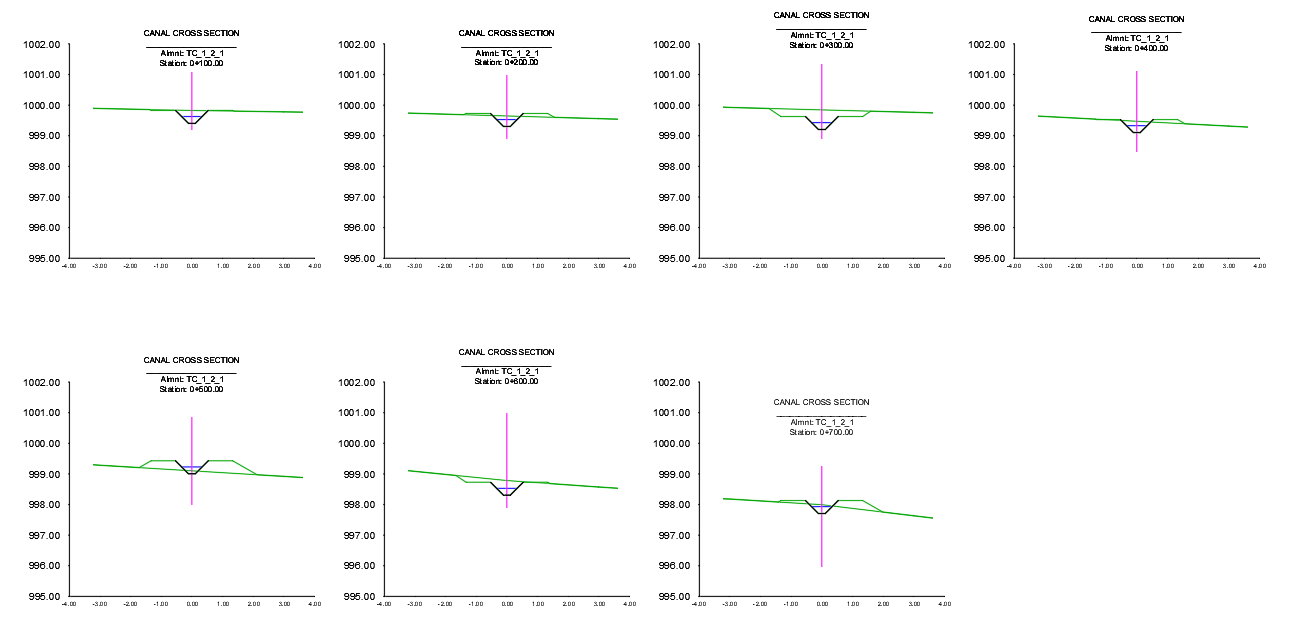
Choose the desired option. Then an iteration for each incremental station is carried out. This attempts to generate the cross-section data at each incremental station. In this example, for instance, 7 cross-sections are found for the shown canal, i.e., at 100, 200, …, 700m station values, and 4 columns is input which means the plot will be 2x4 array of drawings.
Input the desired number of columns to be used for generating the cross-section drawings. The dialog shows how many drawings are selected.
Choose the desired scaling and presentation options in the dialog below.
Note: It is essential for cross-section drawings to have equal horizontal and vertical scaling. To ensure this, choose ‘Plot Extents’, and set scaling to desired value.
You can also include grids in the plots.
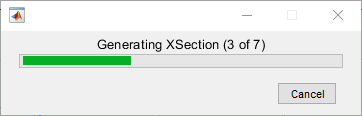
The plotting progresses.
The resulting AutoCAD drawing looks similar to below, as specified a 2 x 4 array drawing.
2. Cross-Sections for custom list
You can also generate cross-sections at select stations. To do this:
start by switching off the XSEC toggle button at the top of the detail view area. Then start the command. You will be prompted with available options for incremental cross-section generation.
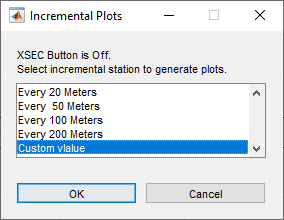
Choose Custom Value option. This will start an other dialog with the list of all stations where data is available for cross-section drawing.
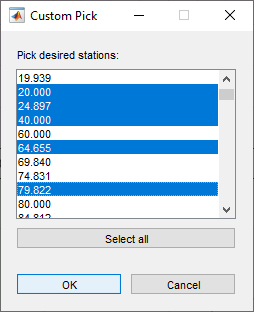
Choose by clicking or draging. Use CTRL + Click to select/deselect individual stations.
The plots are generated for each of the selected station as explained for the previous method.
Note: Stations are rounded upon rendering. For instance station value 24.987 is drawn to AutoCAD with annotation 0+24.90.
3. Cross-sections at saved locations
This method requires an existing set of saved stations where cross-section drawings are required. Refer to documentation on Longitdinal Design of Routes, to learn how to create and save station data for cross-section generation.
To generate drawings for saved stations:
Toggle-on the XSEC button. Any saved stations will be listed, and also marked on the profile view.
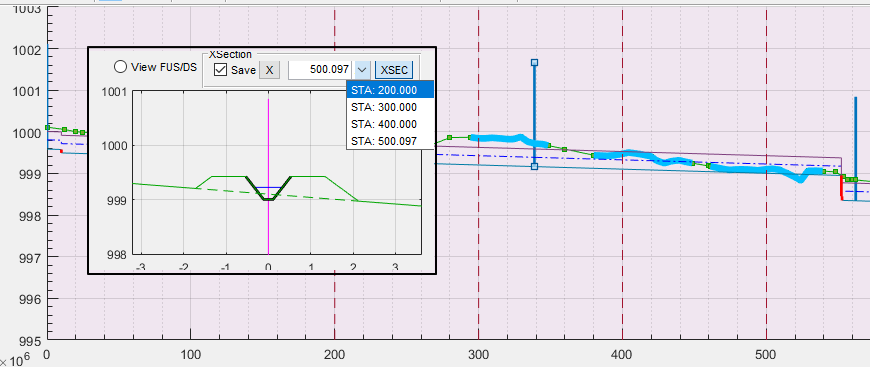
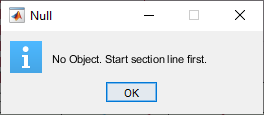
Click on any one station marker on the profile view, to change it to active (continuous line.)
Note: Making one of the station markers active is important. Else, cross-sections could not be created, and process will not succeed with the following message.
Start the command from Workflow > Batch Process > XSection Plot to AutoCAD. You will be promoted to confirm your desired row size for plot generation.
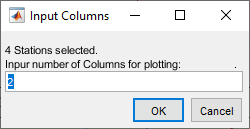
Provide the desired array size for creating the drawings, and Click Ok.
Follow the proceedure for method one above to complete from this step onwards.
Note: While in plan view, the batch process for XSection drawing generation will only create drawings for those cross-sections whose stations are included in the START and END stations of the plan view.
Generating drawings for Canal Structures
Special structures, such as Head Regulators, Cross-Regulators and Inclined drops are designed outside of CanalNETWORK using iCAD’s CanalStructuresJETmodule. A complete set of tools is available with in iCAD environment the drawinsg for these structures.
Refere to pertaining documentation on Design of Canal Structures using FLoating Nodes, for details. Note, the drawings can be overlayed on a generated plan view to create woring drawings, such as the one shown below for canal intersection location.
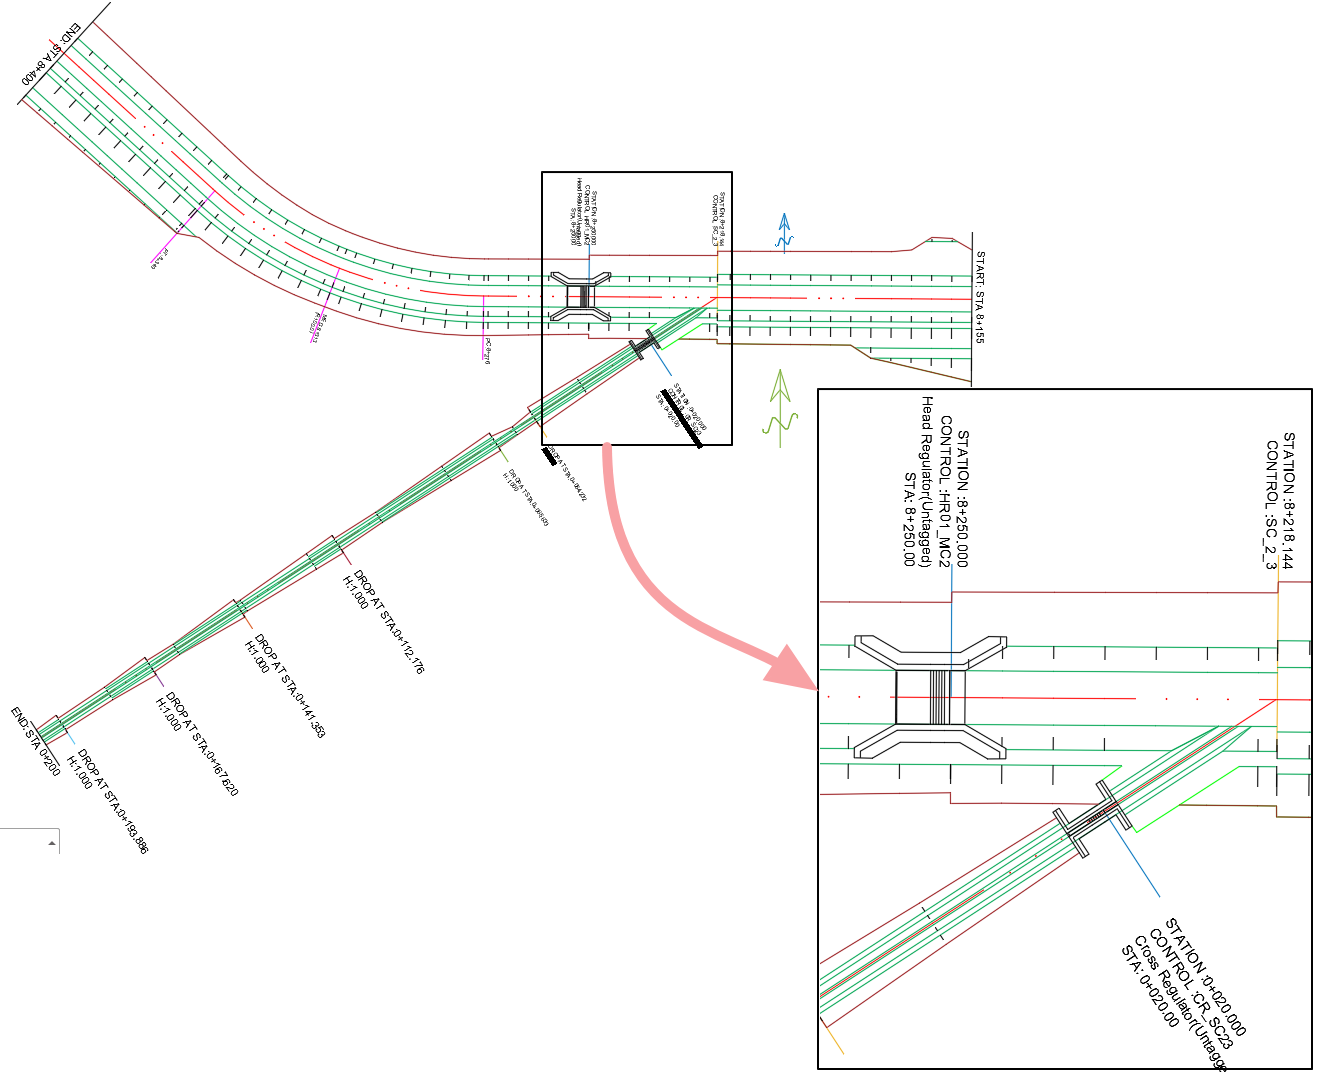
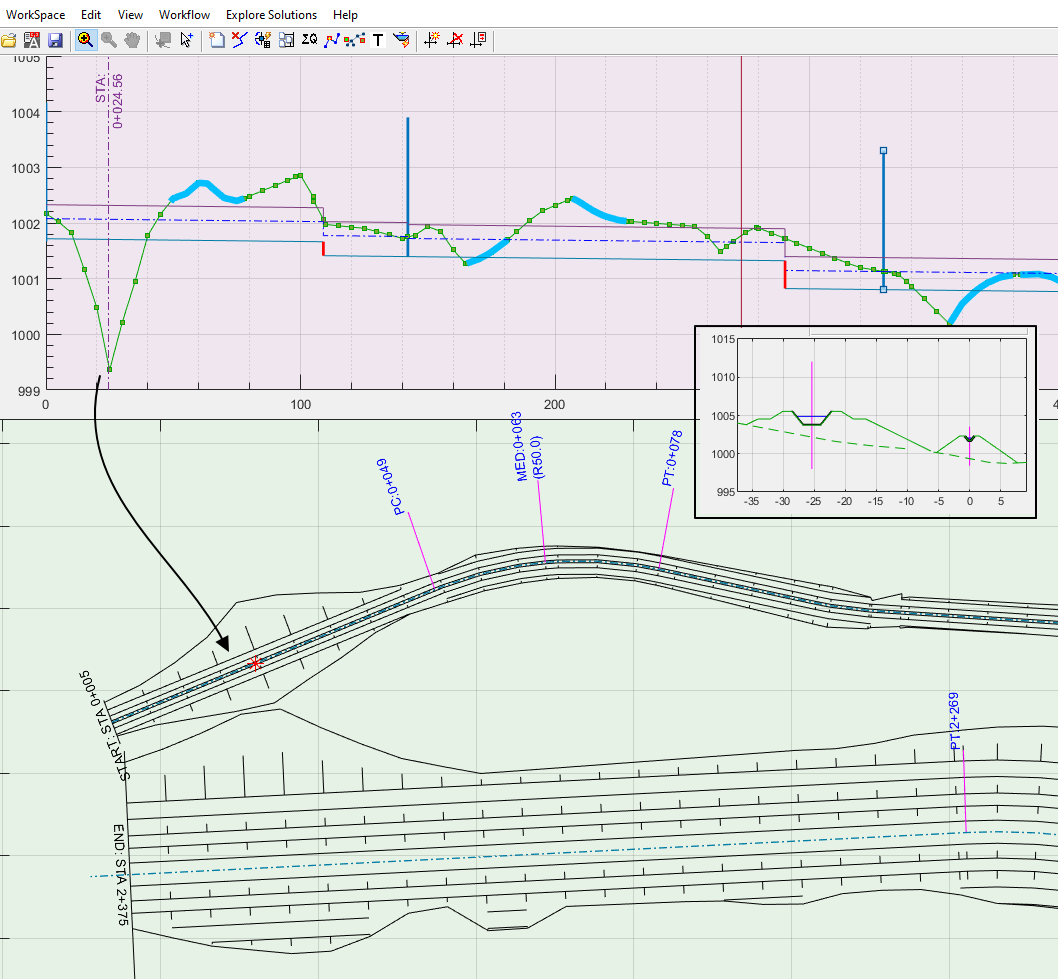
Plan View
Plan view is a key product in the design workflow. It presents detailed alignment and embankement information, along with locations for various structures and station markers along the route. Plan views are also used to provide a view of parallely running canal routes, to refine any constructabilty issues.

Generating Full Length Plans
To succesfuly generate plan views for a given route, the profile data must be fully updated. To do this, while the route is selected in plan view:
-
Clear any selection in Profile View area
-
go to
Explore Solutions > Table Data > LSec Profile Data. This will update the profile data for the route.
Then, you can start plan view generation. There are two steps to generate plan view:
-
Create the plan view data from
Explore Solutions > Plan View (Current Route).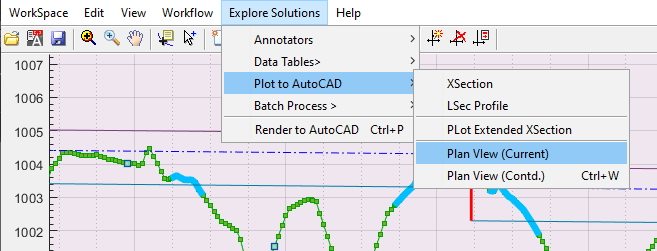
This will automatically start creating the data. However, if there is an existing data, you will be promoted with the Re-extract Trail? dialog.
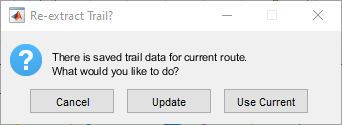
Choose
Updateif there are any changes to CBL information, otherwise chooseUse Current. -
Next the Edit Variables dialog is open, allowing to set specifications for creating the plan drawing.
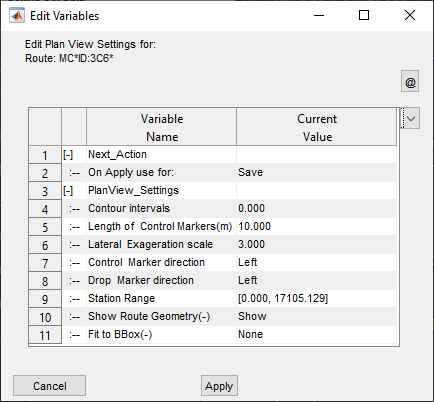
OnApply: Save option simply saves the settings. Generate Drawing option creates the drawing per the table of specification. Use the
Saveoption.Contour Intervals: the inverval value to be used to generate contour lines with the plan view. a value of <0.5 indicates, no contour is needed. Default is set to 0.
Length of Control Markers: The length of control markers on the plan view. This will also determine the length of station/curve markers.
Note: Providing 0 value supresses all markers. Providing too large a value could result in curve markers crossing each other, giving poor presentation quality. Recommended values are:
-
Large canals 20-40units
-
small canals 5-10 units
Lateral Exageration Scale: Often canal layouts appear as narrow and to conjusted, making it difficult to view details and poor presentation. To aid this, an exageration scale can be set between 1 to 10. Usually, 3 to 5 gives good drawings.
Note: When exageration scale is applied, the distance normal to the route center line is multiplied by the specified scale factor. True ground distance is obtained by dividing the measuered distance in AutoCAD environment to the product of this scale value and that of the plot scale.
Note: too large exageration values may distort true appearance of the layout components on edge, and RoW markers, as well as on contour lines - especially on curve locations.
Note: On posed plan view generation (generating plans of adjacent routes) the exageration scale is set to 1.0.
Control Markers and Drop Markers Direction: The direction of marker lines with respect to the centerline of the alignment route.
Station Range: The range of values to generate plan view for. These are automatically rounded to the nearest available value on the station date list.
Show Route Geometry: control the visibility of route center line, and all curve and control markers.
Fit BBox: Set to None, the plan view is generated in natural North UP orientation. When set to Pick AutoCAD, the user is prompted to pick a bounding object in AutoCAD. The drawing creation attempts to automatically determine the best orientation and scaling for the drawing to fit in to the selected area.
Tip: Upon creating the drawing to AutoCAD the exageration scale is exported along with the north symbol. Use the
Aligned Annotationaddon tool to generate this info.Upon hitting
Apply, the settings are saved, and the command exits. -
-
To create a plan view from the updated data just created above, make sure selection in profile view is cleared, and go to
Explore Solutions > Plan View (Contd).This will invoke the variable editor again, allowiing to revise any settings.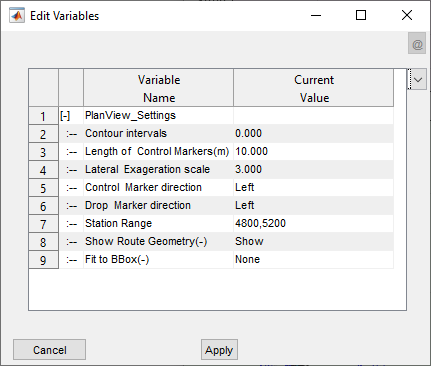
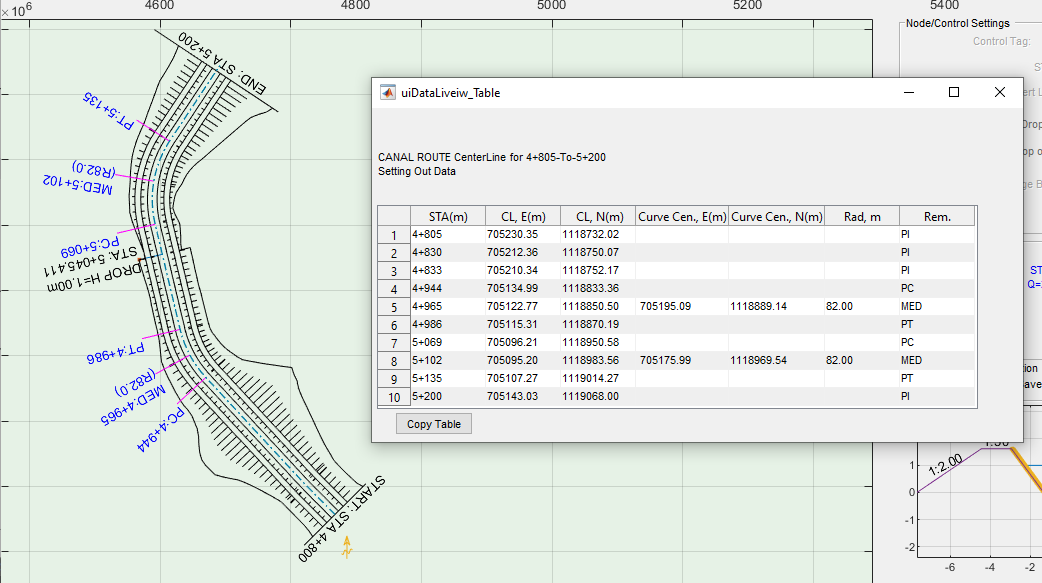
Note the Station Range values are set to the default values of start to end of the route. You can input a valid range, and hit apply. The plan view is generated as shown below. A table data describing the setting out detail for the route of the specified station range is also included.
Note: To create full length plans, leave station range to default values, or seleect full range from the drop down menu.
-
To exit from plan view, right click on Plan View Area and choose
Refresh Nodes and Routesoption. This will clear the plan drawing, and repoulate route and node information.
Generating plan views for selected segements
One can quickly create a plan view for a segment of the route profile as follows:
-
Select a segment in the profile view area.
-
start the command
Explore Solutions > Plot to AutoCAD > Plan View (Contd)or use Ctrl+W short cut. The plan fof the selcted segment is generated.
This step is particularly helpful when making modifications to the CBL of a segment, and an updated plan view is needed to see the change. Simply start the profile data update command (Ctrl+L) and request the plan view (Ctrl+W). This saves significant time, especially when working on very long canals where the drawing creation time is relatively longer.
Generating plan view for user selected range
One can also create plan views from an interactively selected window. To use this method:
-
Select any node in profile view area.
-
Start the command Ctrl+W. An cursor waits for user input. Click and drag to create the rectangle that represents the desired range of plan view generation. Release when done.
-
If the range selected specifies a length less than 100meters, the command exits after blinking the rectangle. Otherwise, the plan view is created for the desired range.
Exploring Sections in Plan View
You can explore sections in plan view in one of two ways. Start the Cross-Sections command from XSEC button, and click on a vertical section bar (solid, not dotted) created in profile view. An interactive vertical bar is created that allows you to pick a section. As you hover in the profile view, a red start marker is shown in plan view, pointing to the exact location of the selected station. Upon click, the section for that station is generated.
Note: This tool also works with any of the annotation markers and drop positioning tools.
You can also create a data tip in plan view along the centerline of the route, and use Ctrl+G key short cut. This will start a dialog confirming the station. Hit Ok to create the section.
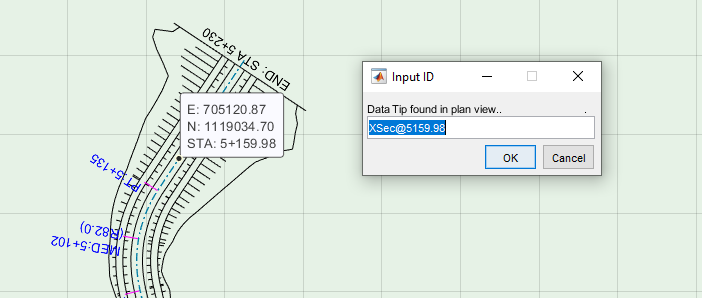
Note: Station information on Data Tips of plan view are re-calculated based on rendered geometery, and may not always be precise to actual stations used to create the cross-section view.
Creating Extended Plan Views
You can generate plan views of two parallelly running canals at the same time, to see any overlap issues or to confirm if adeuate space is maintained between the two. To do this:
-
First, click on the larger canal route which whose plan is needed, and pose it using
Explore Solutions > Plot Extended XSectionmenu command. This will invoke the dialog shown. Accept to confirm.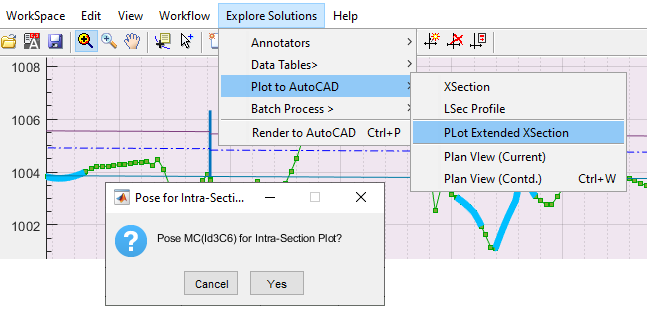
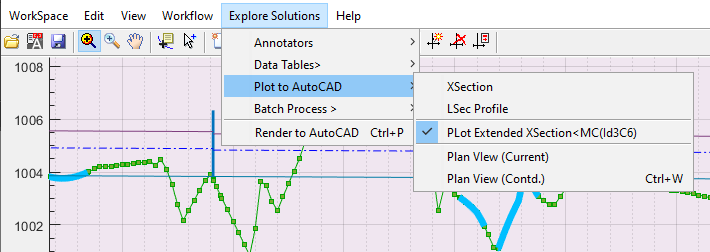
If you go back to the menu, you will notice that the menu is Checked with the name and ID of posed route.
-
Then go to plan view, and click on the other canal route running close to posed canal above and parallel to it. Use one of the above methods to specifiy a plot range for the plan view. The plan view is created for the specified range for both routes.
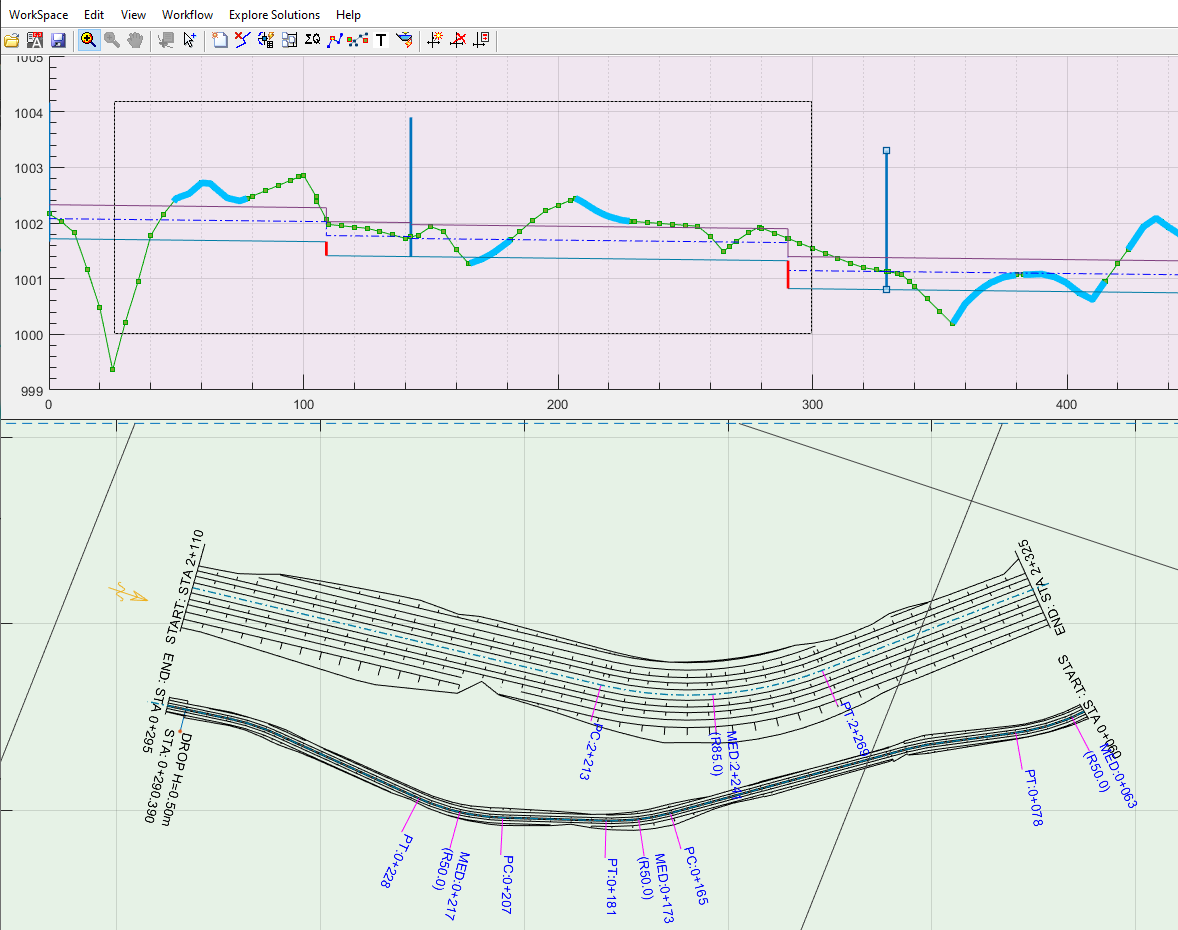
Note: The range for the posed canal is estimated automatically. No need for the user to input this value.
You can use explore methods mentioned above to visualize and interact in all three view areas.
Note the following points when using this method:
-
Both routes should be uptodate for profile data and plan view data for a succesful plan view creation.
-
Exageration scales are set to 1.00.
-
Contrours may or may not be created depending on the plan view creation settings of both routes.
-
Contours, if created, can not be plotted, because there are two instances of the same data type on plan view.
Exporting plan view to AutoCAD
-
To generate the drawings to AutoCAD, use the standard tool from
Workflow > Render To AutoCADorCtrl + P, The first step would be to copy the axes information to the region of plot in AutoCAD, hence choose Copy BBox.![[ ]](Images/Image%20010.png)
Then selct Plot to BBox (AutoCAD) option, and upon prompt in AutoCAD, pick the object that defines the drawing area.
![[ ]](Images/Image%20011.png)
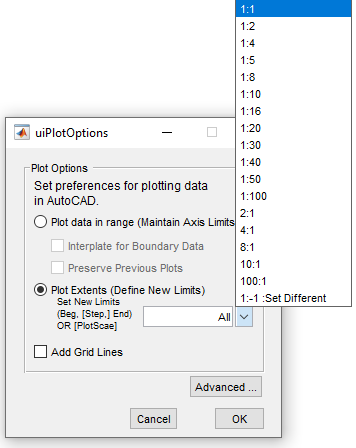
On On the
uiPlotOptions dialog box, choose:a) ALL: if the plan view is generated using a fit area (as shown in the second figure above)
b) specify a plot scale, otherwise.
![[ ]](Images/Image%20012.png)
Choose Plot scaling depending on the type of plan view drawing desired
![[ ]](Images/Image%20013.png) Axis reference information created to AutoCAD environment
Axis reference information created to AutoCAD environmentOnce the axis information is created in AutoCAD, along with a referenced starting object, use
Workflow > Render to AutoCAD, select all objects, and clickApply. Upon prompt, choose the referenced object, and follow the dialogs to complete generating all groups of objects to AutoCAD.![[ ]](Images/Image%20014.png)
Use Select All button to choose all groups of objects.
![[ ]](Images/Image%20015.png)
Fig AutoCAD drawing, after few edits on line colors, and text annotation creation.